
![]()
Connections Through Time, Issue
13: October - December 2001
![]()
Unfortunately, a horrific global event occurred on Sept 11 which provided an opportunity for evaluating the GCP approach. Here are some results from the early analysis of the GCP data, including diametrically opposed interpretations of the same data. Welcome to the often controversial world of physics.
Figure 1 shows one measure of the randomness in the data.
 |
|
Figure 1. Seven days of processed GCP data are shown in red with an example of a 0.05 probability envelop curve. This blue envelop is one way to examine the deviation from chance occurring on September 11. The square indicates the beginning of the terrorist attacks. (The Cumulative Deviation of Chisquare, left-scale, and other statistical information are discussed here. The left scale goes to about 20*E2 = 2,000.) |
Figure 2 shows, for the single day of September 11, the GCP data processed differently to get another variable of interest. More detailed timing for the attacks is also shown. These plots are examples of how the data being collected are analyzed and plotted. Remember however, that only the detailed statistical analyses and peer review process will determine whether anything called "Global Consciousness" can be scientifically demonstrated with these RNG data.
 |
|
Figure 2. The red curve is from the GCP data for September 11, 2001. The small squares show the timing of the two airplane crashes into the Twin Towers, the airplane crash into the Pentagon, and then the collapsing of the two towers (the first crash occurred at about 8:45 EST). Of particular interest are the long rise beginning at around 5 am and the drop beginning at about 11:30 am. The blue curve is pseudo-random data indicating the fluctuations normally expected. (The variance is the square of the standard deviation. The statistics are discussed here and near the end of here ). |
The conclusion reached by Dr. Dean Radin, who is a Senior Scientist for the
Institute of Noetic Sciences, as reported in his draft
report is:
Based upon an analysis of 3 months of GCP data, I conclude
that a statistical anomaly occurred that was associated with the date, time and
general location of the terrorist attacks of September 11, 2001. There is
also evidence that the anomaly began to appear a few hours before the widely
visible events unfolded.
A very different conclusion was reached by Dr. Ed May and Dr. James Spottiswoode of the Laboratories of
Fundamental Research in their
report. We conclude that the network random number generators produced
data consistent with mean chance expectation during the worst single day tragedy in
American history.
... We also provide verification of a separate analysis posted by
Dr. Dean Radin, but we differ markedly with regard to the posted conclusions.
Using
Radin’s analysis, we do not find significant evidence that the GCP network’s EGG’s
responded to the New York City attacks in real time. Radin’s computation of 6000:1 odds
against chance during the events are accounted for by a not-unexpected local deviation
that occurred approximately 3 hours before the attacks.
This serious difference of opinion is primarily due to the fact that there was no pre-defined statistical approach for testing "statistical significance" for unexpected global events such as occurred on September 11. The validation of scientific hypotheses and models cannot be done with statistical approaches defined after the experimental data, or event data, are obtained. The GCP is working to define an appropriate approach for scheduled global events. Treating the unexpected global events is, obviously, even more difficult and remains unresolved.
Analyzing the event data from September 11 may be extremely valuable for defining such a statistical approach which would then be applied to all previous global events in the GCP database to determine if this definition works. And then, the ultimate test is to use the same definition on future global events.
In looking for this statistical approach, Radin focused on 3 months of GCP data from June 15 through September 16, 2001. Figures 3 and 4 show 2 plots from Radin's post-event results report that use a 5 minute consolidation of the per-second data, a 6-hour sliding window, and a modified approach for getting the chisquares. The sliding window results are plotted at the last second associated with the window. Thus, a point plotted at 9am includes data from 3am through 9am.
|
|
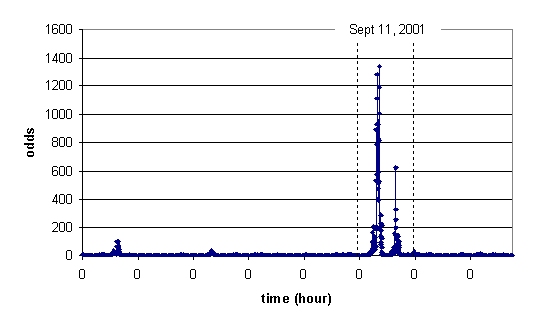
Figure 3. The odds against chance versus time are plotted for the RNGs using the statistical approach of Radin. The GCP data are for September 6, 2001 through September 13. The 0's represent the start of each day EDT. |
Radin analyzed sliding windows ranging from 5 minutes to 12 hours in
duration, using 5 minute
increments for a total of 144 windows. He found that 60% of the maximum
"odds against chance" occurred on September 11. Radin suggests:
This indicates that the anomaly
observed on September 11 is not especially sensitive to the choice of specific
window lengths. ... The majority of maximum z scores appears in
window lengths ranging from 5.2 to 6.8 hours, suggesting that the length of the
"event" on September 11 may be in this range.
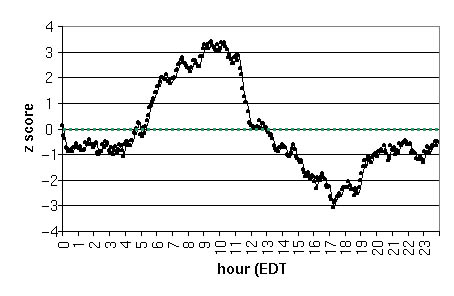
The two peaks in the odds on Sept 11 are a direct consequence of the unusual behavior of a key statistical measure, called a z-score, shown next. The z-score is the normalized measure of the standard bell-shaped or "normal" statistical curve. (The math is discussed here.)
 |
|
Figure 4. The z-score data is for Sept 11, 2001 using a 6-hour sliding window. The odds of dropping 6.5 in z-score in a period of 8 hours or less is about 500 to 1 (based on Radin's permutation analysis of 3 months of GCP data). |
Has the GCP reached any conclusions concerning whether RNGs are affected by global events? No scientific conclusions yet - they are at the beginning of a new area of research. An online update (Oct 19) posted by the Boundary Institute pretty well summarizes the status: 'Preposterous though it may sound, significant deviations have been noted in the randomness of data from these RNGs around times of major events in the world. The questions, of course, are "Is this a real effect?" and, if so, "What is going on?".'
References
Global Consciousness Project, The Project Director is Roger Nelson, Princeton Engineering Anomalies Research (PEAR) Laboratory
Global Consciousness Project Analysis for September 11, 2001, Dean Radin, Institute of Noetic Sciences, Draft - September 21, 2000
Global Consciousness Project: An Independent Analysis of The 11 September 2001 Events Ed May and James Spottiswoode, Laboratories of Fundamental Research.
REG Experiments: Equipment and Design - Random Event Generators are another name for RNGs.
Boundary Institute Summary of Events of Sept 11, 2001
Probability and Statistics Details
Go to another section of this
issue:
Intuition: Individual Intentions Can
Affect RNGs Applications: Protocol
5 Report
![]()